
How cost-push inflation works
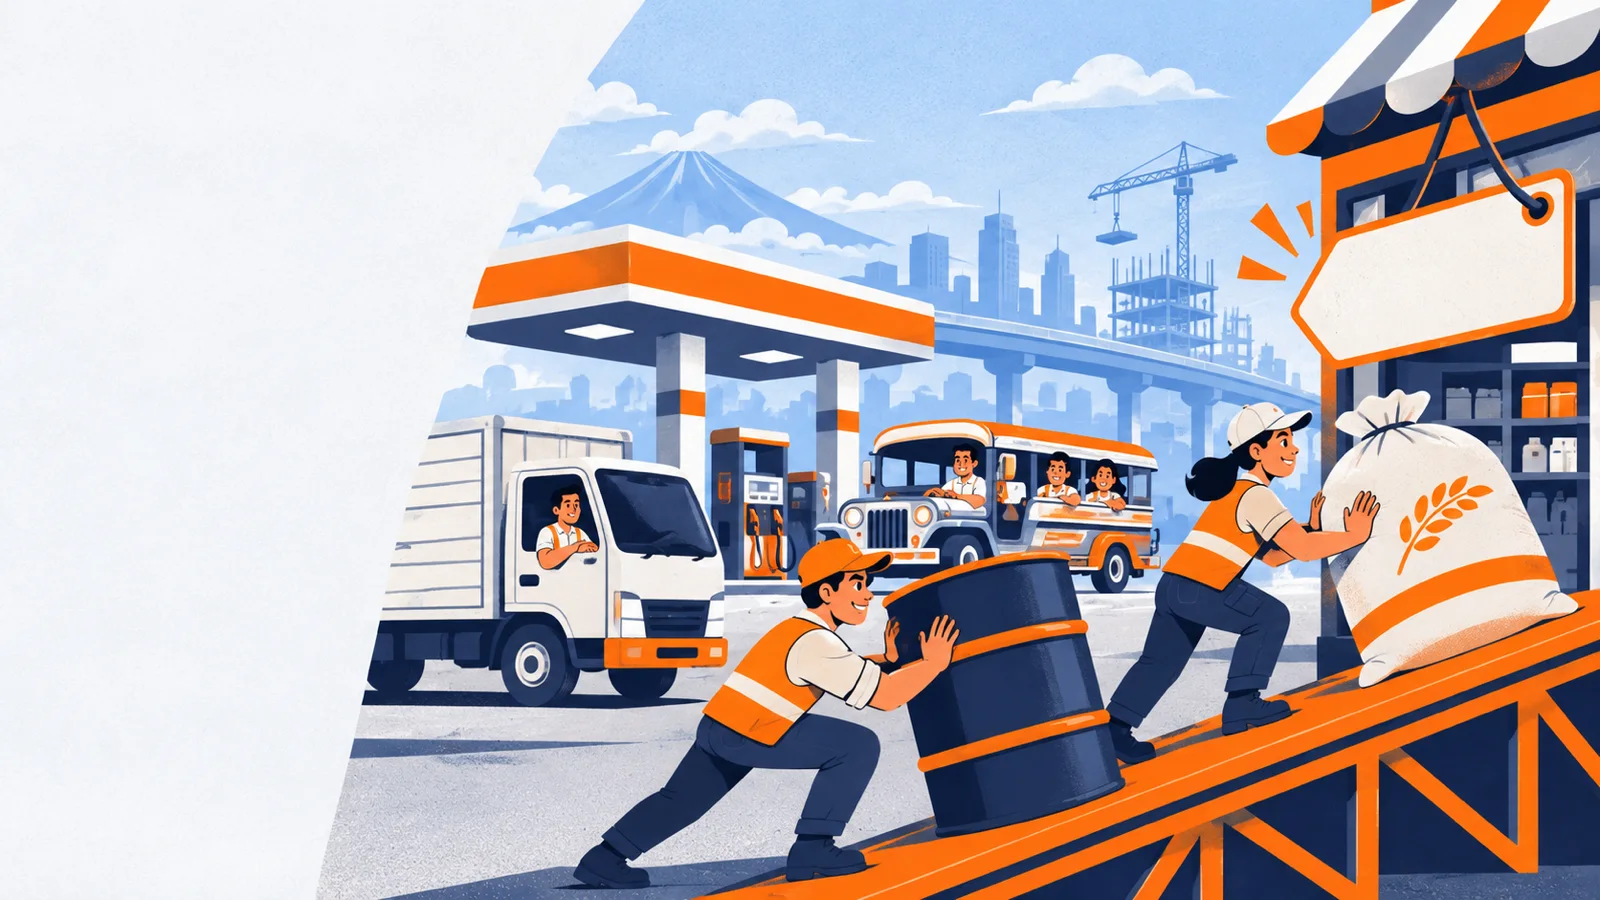
When fuel, rice or electricity get dearer, it costs more to make and deliver almost everything. Firms raise prices to protect their margins, and the economy produces less at each price. In the supply-and-demand diagram above, the supply curve shifts left: output falls and the price level rises.
The IMF describes it as supply shocks "that raise production costs (high oil prices)" (IMF).
Common causes
- Higher world oil prices, which raise fuel, transport and electricity costs.
- Poor harvests, typhoons or import limits that raise food prices.
- A weaker peso, which makes imported fuel, wheat and parts dearer.
- Higher taxes on goods, such as excise taxes on fuel.
- Wage increases that are not matched by higher productivity.
Philippine examples
- 2026: transport inflation reached 20.1% and housing and utilities 9.3% in October 2026.
- 2018: rice led inflation to 5.2% for the year.
- 2008: world rice and oil prices pushed inflation to 10.5% in August 2008.
- 1974: the first oil shock; inflation was 31.8% for the year.
Why it is hard to fight
Raising interest rates cools demand but does not lower the price of oil or rice. That is why the BSP watches core inflation and acts when cost increases start spreading to other prices and to wage demands. Supply measures such as tariff changes, imports and subsidies are set by the government, not the BSP.
Next step: Track transport, utility and rice inflation each month on inflation rate in the Philippines, which updates on PSA's release day.
Questions
What is cost-push inflation in simple terms?
Prices rising because it costs more to make or deliver things, for example when fuel gets dearer.
What is an example of cost-push inflation in the Philippines?
In October 2026, transport prices rose 20.1% from a year earlier, pushing headline inflation to 7.8%.
How is cost-push different from demand-pull inflation?
Cost-push starts with sellers' costs; demand-pull starts with buyers spending more than the economy can supply.
Sources
- IMF Finance & Development, "Inflation: Prices on the Rise"
- PSA OpenSTAT, inflation by commodity group
Figures are PSA's, published under a CC BY 4.0 licence, and update when PSA releases a new month. This page explains official data; it is not financial advice.